


Best MLB Bets Today – Thursday, May 29, 2025

FTN Staff


 Denver Nuggets
 Minnesota Timberwolves
 Oklahoma City Thunder
 Portland Trail Blazers
 Utah Jazz
 Dallas Mavericks
 Houston Rockets
 Memphis Grizzlies
 New Orleans Pelicans
 San Antonio Spurs
Every Monday, I find myself in a bit of NFL data purgatory. We’re waiting for the week to come to a proper ending and the data is still yet to be finalized. It’s a great time, however, to look at some historical trends and do some digging on some things we can leverage in the upcoming week. This piece will be out on Tuesdays but won’t have the same format or topic each week. The formula will change as I poke around with the data we have access to here. It’ll just be my musings on something that caught my eye. If there’s something to it, I’ll give you some way to leverage the conclusions in fantasy for the upcoming week.
I’ve decided that this piece can tackle (no pun intended) and demystify some things that we yell at our TV screen every Sunday. One thing that always leaves me dumbfounded is when a kick returner takes a kick out of the end zone when they clearly shouldn’t have. It’s not like they’re forced to, so why do they do it when they can just have their team start their drive with the ball on the 25-yard line? As with most things, it’s not enough for us to just say “that was stupid”…we’d like to figure out how stupid it was by quantifying it in some way.
To get some context, I wanted to take a look at the historic rate for touchbacks.

I thought there was some quirkiness in the data when I first got this chart together, but then I realized that the kickoff spot was moved up to the 35-yard line in 2011. The kickoff had been taken from the 30 from 1994-2010. So between 2010 and 2011 the touchback rate went up from 16% to 44%. That obviously had downstream implications to the game itself. It’s steadily climbed up to about 60% over the last couple of years.

The rules changes directly affected where teams are starting their drives after they receive a kickoff. The difference between starting your drive on the 22 and the 27 – which was about the difference between 2010 and 2011 after the kickoff moved or the difference between 2015 and 2016 when the touchback moved – didn’t change scoring much.
|
Field Position |
Average Points Scored (TDs = 6 Points) |
Rate of points scored on drive after kickoff (TD or Field Goal) |
| Starting 21-23 | 1.34 | 27.2% |
| Starting 26-28 | 1.46 | 30% |
This year, the touchback rate has climbed even further. It’s at 63% through the first month or so of the season. With that increase in touchbacks, we’ve seen average starting field position go down a bit. In 2020, kickoff-sparked drives started at the 25.9 yardline on average. In 2021, so far, we’ve seen teams starting behind their own 25 (24.8, to be exact).
A lot of that has to do with a small sample size and no particularly long run-backs to this point. Coming into the week, there were only two kick returns that went for more than 50 yards. If we look at how many kickoffs teams are facing vs. how many touchbacks they’re electing to take, we can get an idea for aggressiveness (or lack thereof) on a team level.
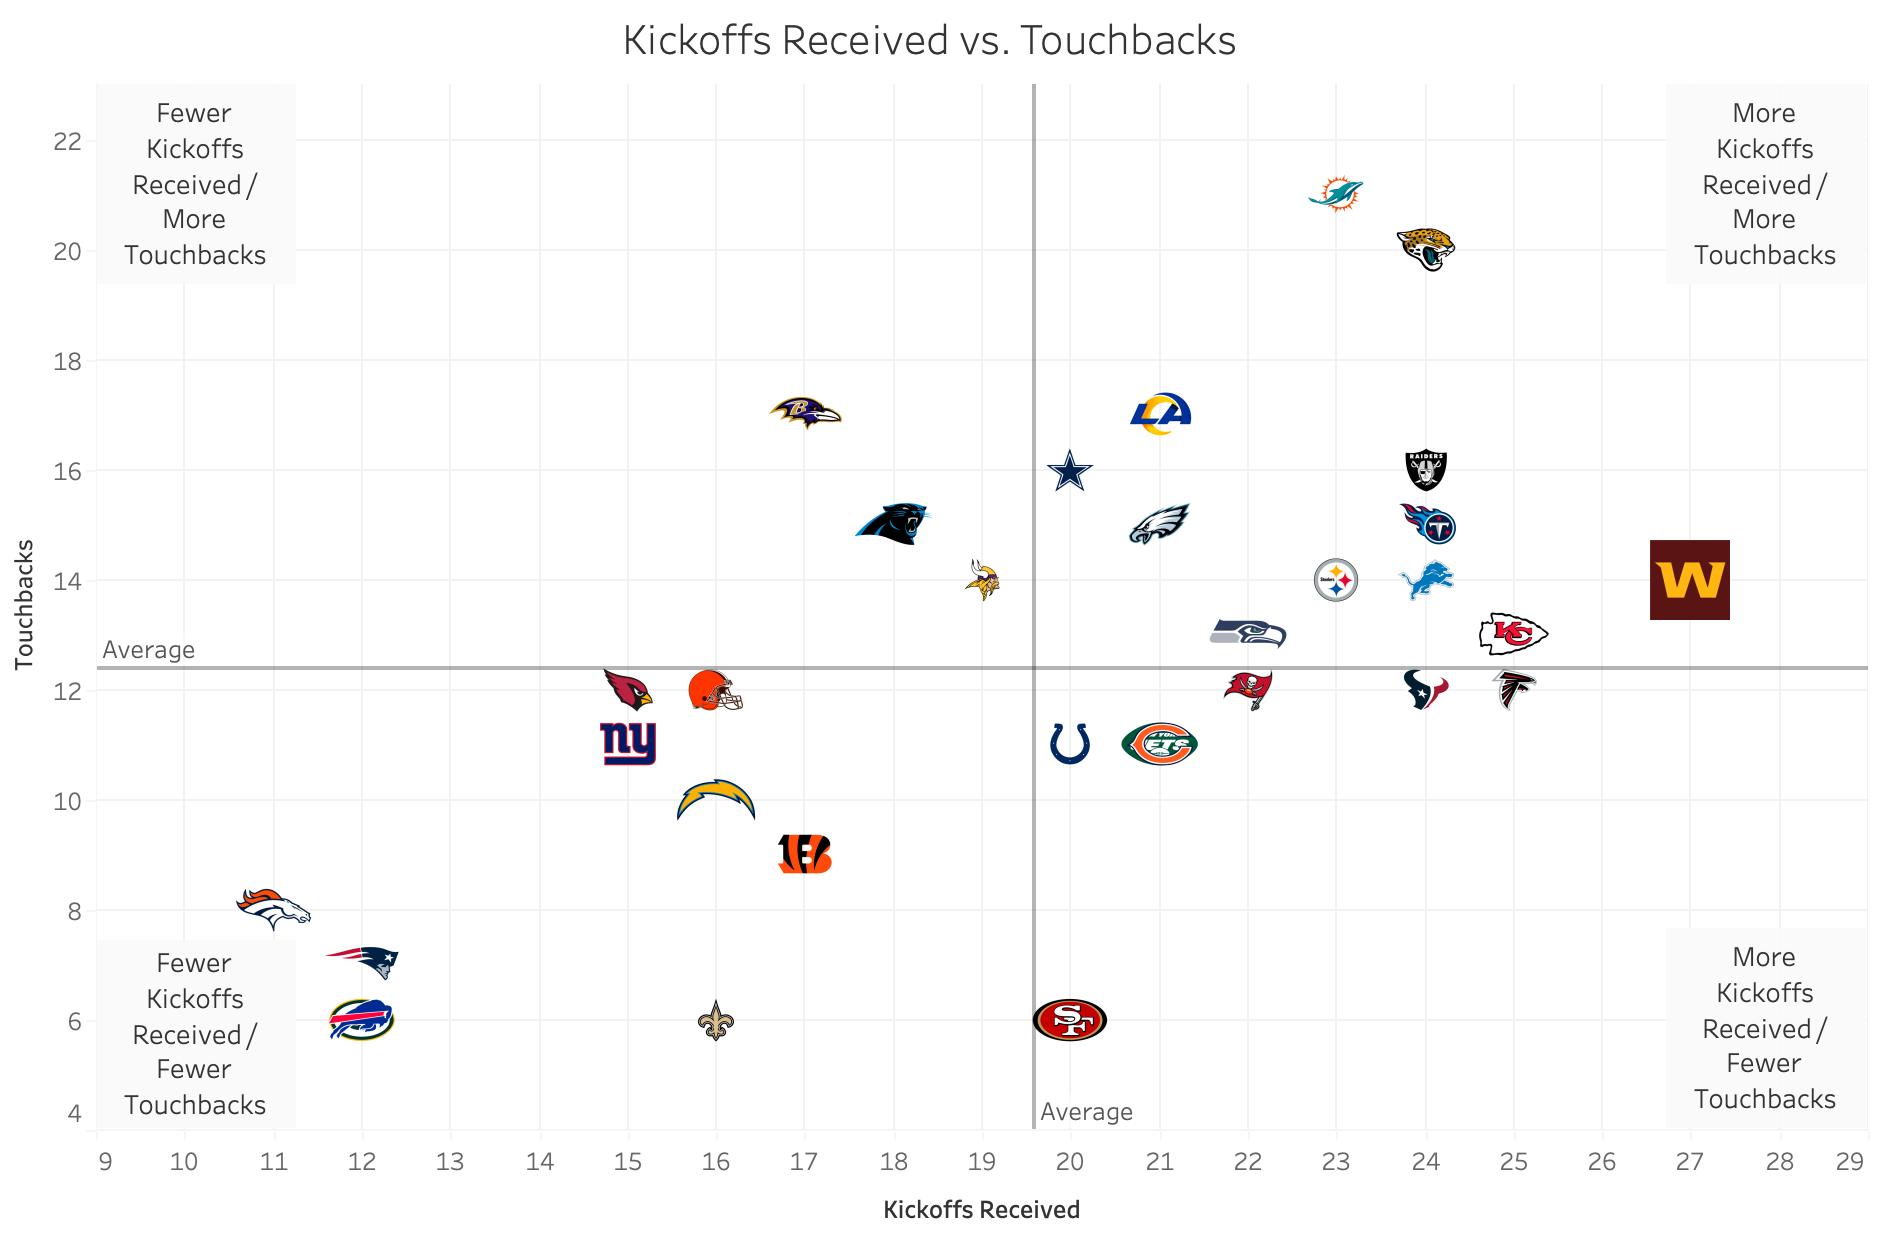
Note: Buffalo/Green Bay and Chicago/New York Jets are paired up at the same spot on the graph.
The lower-right quadrant holds the aggressive teams. They are seeing the most kickoffs but the least touchbacks to start 2021. We know that aggressive doesn’t always mean smart, though, so let’s see how that group has performed in starting field position.

On average, the 49ers, Colts, and Buccaneers are making good decisions when they decide to return the kickoff (meaning they are starting off past their own 25 yard line). The rest of the aggressive group is losing at least some yardage. The Houston return men are costing the Texans an average of five yards every time they return a kick.

This is the top-right quadrant of the first graph in this section. These the teams that are fielding more kickoffs and seeing more touchbacks. As a whole, this group is making better decisions and the Rams, Seahawks, and Steelers are gaining yardage past the 25 when they decide to return a kick.

This is a look at the top-left, which represents the teams seeing the least kickoff return opportunities and taking the most touchbacks. Not much to say here, other than the Panthers seem to be making the most of their chances.

Our last group is the teams that aren’t seeing too many kickoffs but are being aggressive when they do. Buffalo and Denver join San Francisco and the Los Angeles Rams as the only teams to average starting past their own 30 yard line when they decide to return a kick. The difference between the Chargers/Bengals and Buffalo is about 0.8 points per kickoff. Over the course of the season, that’s a significant difference.
We’re always looking for small edges, and the ability to gain field position past where the ball would be placed after a touchback is one of them. It’s of a similar magnitude to a lot of the decisions that we talk about that seem overstated (fourth downs, kicking a field goal vs going for it). Over the course of a season, a few points here and there can be the difference between a couple of wins and a couple of losses.
If there are any fantasy takeaways from this study, it would be to trust in the offenses that are making these smart decisions and putting themselves into position to succeed. If your patience is running thin with players from the following teams, I’d urge you to wait a while longer before doing something drastic:
On the other hand, if you’re relying on ancillary pieces from the following offenses, it might be a losing proposition if they can’t figure out some of these smaller decisions:


 New York Jets
  New England Patriots
  Miami Dolphins
  Buffalo Bills
  Pittsburgh Steelers
  Cleveland Browns
  Cincinnati Bengals
  Baltimore Ravens
  Tennessee Titans
  Jacksonville Jaguars
  Indianapolis Colts
  Houston Texans
  Las Vegas Raiders
  Los Angeles Chargers
  Kansas City Chiefs
  Denver Broncos
  Washington Commanders
  Philadelphia Eagles
  New York Giants
  Dallas Cowboys
  Minnesota Vikings
  Green Bay Packers
  Detroit Lions
  Chicago Bears
  Tampa Bay Buccaneers
  New Orleans Saints
  Carolina Panthers
  Atlanta Falcons
  San Francisco 49ers
  Seattle Seahawks
  Los Angeles Rams
  Arizona Cardinals


 Boston Celtics
  Brooklyn Nets
  Philadelphia 76ers
  New York Knicks
  Toronto Raptors
  Chicago Bulls
  Detroit Pistons
  Milwaukee Bucks
  Cleveland Cavaliers
  Indiana Pacers
  Orlando Magic
  Atlanta Hawks
  Charlotte Hornets
  Miami Heat
  Washington Wizards
  LA Clippers
  Golden State Warriors
  Los Angeles Lakers
  Phoenix Suns
  Sacramento Kings


