While we enjoy baseball’s All-Star festivities, it’s nice to have a break from the daily research and the breaking down of MLB slates. Let’s use this downtime to examine pitchers to potentially fade or back post-All-Star break. There are plenty of arms on both sides of the regression monster to dive into. We’ll be looking into qualified starting pitchers that have run too clean and others that have been on the wrong end of unfortunate results. We’ll examine the largest differences between ERA and SIERA, while incorporating differences between ERA and xERA into their second-half outlook.
People often ask what my favorite or best advanced baseball metric is. My answer is usually SIERA, but the truth is you need to look at more than one stat to get an idea of the entire picture. My response has also changed over the years, as the emergence of xERA has been a powerful addition to advanced MLB metrics. SIERA gives us an idea of a pitcher’s deserved or true ERA, as it considers balls in play and adjusts for the type of ball in play, but it doesn’t incorporate exit velocity and launch angle like xERA. xERA isn’t necessarily predictive, but it is used to show the overall effectiveness and expected performance of a pitcher.
MLB Second-Half Regression Candidates — Pitchers
The Good
| ERA | SIERA | ERA-SIERA | xERA | ERA-xERA | |
| Pablo López | 5.11 | 3.20 | 1.91 | 3.43 | 1.68 |
| Ryan Feltner | 5.37 | 4.17 | 1.20 | 4.09 | 1.28 |
| Yusei Kikuchi | 4.42 | 3.45 | 0.97 | 4.07 | 0.35 |
| Dylan Cease | 3.99 | 3.09 | 0.90 | 3.51 | 0.91 |
| Aaron Civale | 4.94 | 4.05 | 0.88 | 4.15 | 0.79 |
| Patrick Corbin | 5.57 | 4.74 | 0.82 | 6.29 | -0.72 |
| Freddy Peralta | 4.11 | 3.31 | 0.79 | 3.74 | 0.37 |
These aren’t necessarily guys I’m running to blindly back in the second half, but I’ll look for matchups where they can pitch to their strengths and are being undervalued.
Pablo López, Minnesota Twins
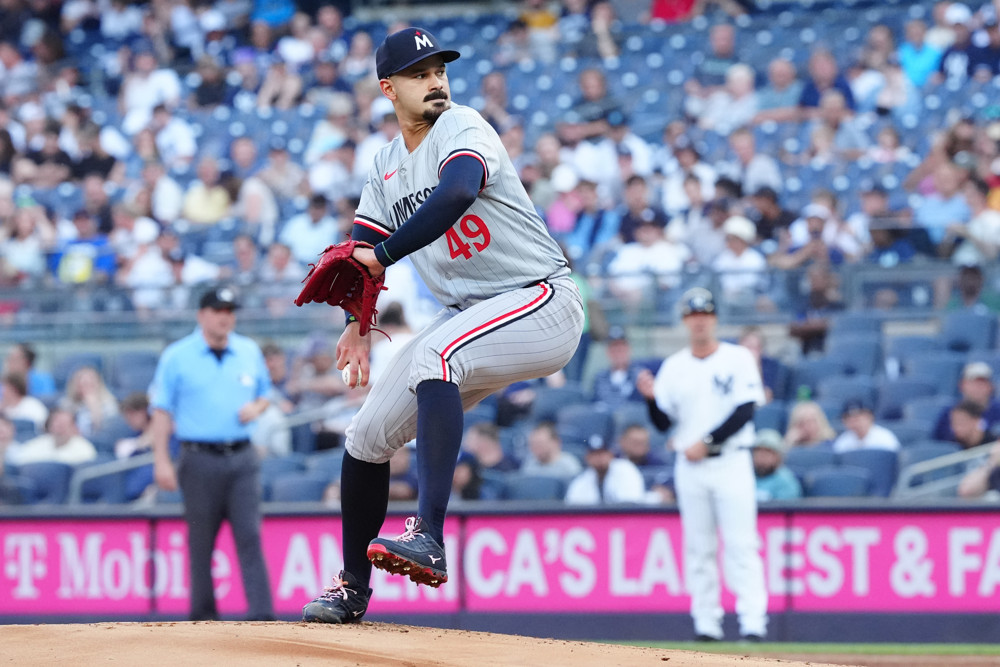
While I hope we won’t be meeting in the second half, my twitter buddy TorresTakes has started a Pablo López support group if anyone is down bad and looking for friends. The Twins’ righty has some of the worst surface stats in baseball among all qualified pitchers — his 5.11 ERA is fourth worst in MLB and 1.56 HR/9 is sixth highest through 104 innings. However, nobody has a larger positive difference between ERA and SIERA than López’ 1.91. His 1.68 difference between ERA and xERA is also the largest. You can’t predict baseball, but it’d be surprising if López and his elite strikeout potential didn’t shove and run clean down the stretch.
Ryan Feltner, Colorado Rockies
I’m not going to waste my time breaking down someone who pitches half his games on the moon that is Coors Field.
Yusei Kikuchi, Toronto Blue Jays
While the 33-year-old sports an inflated 4.42 ERA, his 3.45 SIERA is the best of his career, giving Yusei Kikuchi the third-largest difference in baseball. The southpaw has displayed the best control in 2024 of his six-year MLB career. However, Kikuchi’s expected ERA sits more than half a run higher than his SIERA, given his extremely high barrel rate and hard hit rate, which both sit in the ninth percentile. Truthfully, Kikuchi is a guy I’ve had a tough time projecting game-to-game throughout his MLB career. The fluctuation in his velocity might be the blame for his inconsistencies this season.

(Image via Baseball Savant)
Dylan Cease, San Diego Padres
While I’m sure Dylan Cease has enjoyed the move to sunny San Diego, his results haven’t been as fortunate as some of the numbers might indicate while on the bump. Cease’s 3.99 ERA is certainly inflated, but we don’t have a clear picture on exactly how much regression to expect. There’s a sizable difference between his SIERA of 3.09 and 3.51 xERA through 115 innings. That’s mostly due to Cease’s 11.5% barrel percentage that ranks in the fifth percentile. The 28-year-old’s stuff is elite at missing bats, but when opposing batters do make contact they’re squaring him up. The Padres are going to need Cease to be an ace if they’re going to make a postseason run.
Here are a few pitchers who appeared at the top of the ERA-xERA list that didn’t pop when we looked at ERA-SIERA:
ERA-xERA
| ERA | xERA | ERA-xERA | |
| Spencer Arrighetti | 5.63 | 4.18 | 1.45 |
| Tyler Glasnow | 3.47 | 2.49 | 0.98 |
| Hunter Brown | 4.39 | 3.48 | 0.91 |
| Patrick Sandoval | 5.08 | 4.18 | 0.90 |
| Miles Mikolas | 5.13 | 4.33 | 0.80 |
| Aaron Civale | 4.94 | 4.15 | 0.79 |
| Mitch Spence | 4.75 | 3.98 | 0.77 |
The Bad
| ERA | SIERA | ERA-SIERA | xERA | ERA-xERA | |
| Tyler Anderson | 2.98 | 5.09 | -2.11 | 4.42 | -1.45 |
| Reynaldo López | 1.88 | 3.96 | -2.08 | 4.24 | -2.36 |
| Ronel Blanco | 2.56 | 4.25 | -1.69 | 3.56 | -1.00 |
| Andrew Abbott | 3.39 | 4.75 | -1.36 | 3.51 | -0.12 |
| Marcus Stroman | 3.51 | 4.88 | -1.37 | 4.45 | -0.94 |
| Seth Lugo | 2.48 | 3.80 | -1.32 | 3.93 | -1.45 |
| Corbin Burnes | 2.43 | 3.55 | -1.12 | 3.00 | -0.57 |
Tyler Anderson, Los Angeles Angels
I’ve lost a good number of bets in the first half waiting for Tyler Anderson’s luck to run out. The 34-year-old’s .228 BABIP sits 55 points lower than his career mark of .283. He’s found incredible luck stranding runners at an 83.2% clip compared to his career 72.7% left on base percentage. The southpaw has the largest difference between ERA and SIERA in the game at over two runs. He’s tied for the third largest difference between ERA and xERA. Anderson doesn’t strikeout batters at a high clip with a K% in the 12th percentile, he isn’t effective at inducing ground balls, and he also has walk issues with a BB% in the 28th percentile. Combine that with a barrel rate in the 35th percentile, Anderson has no business sporting an ERA under three through 118 innings. Regression should come at Anderson fast and I’ll be fading him against clubs that mash lefties.
Reynaldo López, Atlanta Braves
Reynaldo López is someone I had in mind to back in the strikeout market this past off-season when I wrote about pitchers moving from the bullpen to the rotation in Vlad Sedler’s FTN Fantasy Baseball Guide. But I didn’t ever expect him to run so good to where he’d have the lowest ERA in all of baseball. Like Anderson, López has been extremely fortunate stranding runners on base in 2024. His LOB% sits at 86.9%, well above his career mark of 73%. But it’s the hard contact as well for López that shows regression, with a barrel rate in the 34th percentile and a hard hit rate in the 39th percentile. While López has cut down on a career high walk rate in 2023, his 2024 BB% sits in the 39th percentile through the first half. López isn’t an elite strikeout pitcher (68th percentile) either or ground ball inducer (26th percentile), so he’ll have to improve the type of contact he allows and reduce the walks if he wants to continue to suppress runs at an elite level.
Ronel Blanco, Houston Astros
There’s no telling how far down in the standings the 50-46 Astros would be without Ronel Blanco. The 30-year-old has nine victories on the season with an incredible 0.97 WHIP. The righty has stepped up with Houston currently having five legit starting pitchers on the IL: Luis García, Cristian Javier, Lance McCullers Jr., Jose Urquidy and Justin Verlander. Blanco’s 2.56 ERA ranks sixth-best in MLB but that’s backed by an unsustainable .178 BABIP and 86.3% LOB%. The right-hander has suppressed hard contact for the most part but is still getting barreled (30th percentile). Blanco has allowed too many free passes with the fifth-highest BB% in baseball – tied with Tyler Anderson. The Astros are hoping the 30-year-old’s luck doesn’t run out in the second half as they make a run at another AL West title.
Here are the arms right behind the guys we looked at with some of the largest negative differences between ERA-SIERA.
ERA-xERA
| ERA | xERA | ERA-xERA | |
| Brady Singer | 3.20 | 4.88 | -1.68 |
| Seth Lugo | 2.48 | 3.93 | -1.45 |
| Javier Assad | 3.27 | 4.72 | -1.45 |
| Colin Rea | 3.77 | 5.08 | -1.31 |
| Miles Mikolas | 5.13 | 4.33 | 0.80 |
| Michael Lorenzen | 3.52 | 4.82 | -1.30 |
| Tanner Houck | 2.54 | 3.71 | -1.17 |
There are a handful of other pitchers we could go through and even expand with another 500 words on these guys but this is supposed to be a break! You can check out FTN’s MLB Starting Pitcher Ratings & Rankings for even more expected data. It includes xERA, xK%, xBB% and more. Good luck in the second half.
Data pulled from FTN, FanGraphs & Baseball Savant.


 New York Jets
  New England Patriots
  Miami Dolphins
  Buffalo Bills
  Pittsburgh Steelers
  Cleveland Browns
  Cincinnati Bengals
  Baltimore Ravens
  Tennessee Titans
  Jacksonville Jaguars
  Indianapolis Colts
  Houston Texans
  Las Vegas Raiders
  Los Angeles Chargers
  Kansas City Chiefs
  Denver Broncos
  Washington Commanders
  Philadelphia Eagles
  New York Giants
  Dallas Cowboys
  Minnesota Vikings
  Green Bay Packers
  Detroit Lions
  Chicago Bears
  Tampa Bay Buccaneers
  New Orleans Saints
  Carolina Panthers
  Atlanta Falcons
  San Francisco 49ers
  Seattle Seahawks
  Los Angeles Rams
  Arizona Cardinals


 Boston Celtics
  Brooklyn Nets
  Philadelphia 76ers
  New York Knicks
  Toronto Raptors
  Chicago Bulls
  Detroit Pistons
  Milwaukee Bucks
  Cleveland Cavaliers
  Indiana Pacers
  Orlando Magic
  Atlanta Hawks
  Charlotte Hornets
  Miami Heat
  Washington Wizards
  Denver Nuggets
  Minnesota Timberwolves
  Oklahoma City Thunder
  Portland Trail Blazers
  Utah Jazz
  LA Clippers
  Golden State Warriors
  Los Angeles Lakers
  Phoenix Suns
  Sacramento Kings
  Dallas Mavericks
  Houston Rockets
  Memphis Grizzlies
  New Orleans Pelicans
  San Antonio Spurs


