


NBA Postseason Best Bets (5/17)

Alex Christenson


When the Carolina Panthers selected Bryce Young with the first overall pick in the 2023 NFL Draft, they had visions of him leading the league in statistical categories left and right, and duking it out with the other titans to achieve glory in the NFC South. And, indeed, we saw Young in a race at the top of one of our leaderboards right up to the final week of the season, when he sadly just ran out of gas before he could quite catch Derek Carr and the hated New Orleans Saints. Yes, everything went exactly according to plan, with the possible minor exception of the stat in question being failed completions.
A failed completion is any completed pass that fails to gain 45% of needed yards on first down, 60% on second down, or 100% on third of fourth down. They are the empty calories of completion percentage – the third-and-long screens that don’t break, the angle routes that get clobbered a half-yard past the line of scrimmage, and the futile checkdowns to avoid pressure. Strictly speaking, they’re still better than an incomplete pass as long as they gain yardage, but they’re putting your team in difficult down-and-distances and lowering your overall chances to win.
This is a topic we cover every year, and we’re sad to report that failed completions continue to spread throughout the league. 2023 saw the NFL set records with 3,260 failed completions and a 27.6% failed completion rate. That’s one of the reasons it can feel like offense is down around the league, even though more passes than ever before are being completed. The combination of a generation of star quarterbacks retiring and defenses settling into solid two-high coverage shells that not every offense has cracked yet has led to passes being shorter than they have in years, threatening to drop under the 7.0 yards per attempt barrier for the first time since the mid-2000s. The passing game is happening closer to the line of scrimmage ever before.
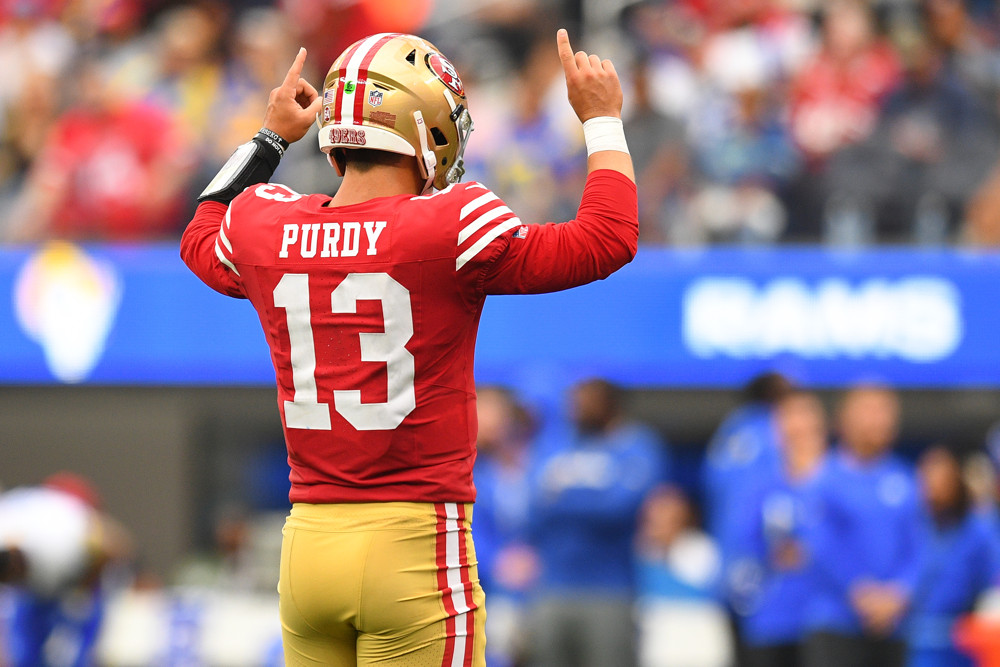
But it’s not all doom and gloom, as a 24-year-old passer stuck his name high atop the record books this year. We can argue about whether he should have been an MVP or an All-Pro, but the statistics are clear: he’s Purdy good.
As a side note, not every failed completion is created equal. For the purposes of this article, however, we’re treating it as a binary, simply summing up successes and failures. A 7-yard completion on third-and-10 is better than a 2-yard completion, especially when you start getting into field goal range. That’s reflected in DVOA, but not here – for the purposes of this article, a failure is a failure.
Failed Completions In the following table, the 36 qualified quarterbacks of 2023 are ranked by ascending failed completion rate (FC%). We also included failed completions as a percentage of attempts (very little change in the rankings) as well as the average ALEX (all downs) for the season. “Passes” here refers to all passing plays, including sacks.
| Quarterbacks, Failed Completions, 2023 | ||||||||||
| Rk | Player | Team | Pass | Cmp | Failed | FC% | FC% ATT | Rk | ALEX | Rk |
| 1 | Brock Purdy | SF | 472 | 308 | 55 | 17.9% | 11.7% | 1 | -1.0 | 18 |
| 2 | Joe Flacco | CLE | 213 | 123 | 26 | 21.1% | 12.2% | 2 | 0.5 | 2 |
| 3 | Matthew Stafford | LAR | 556 | 326 | 71 | 21.8% | 12.8% | 3 | -0.5 | 11 |
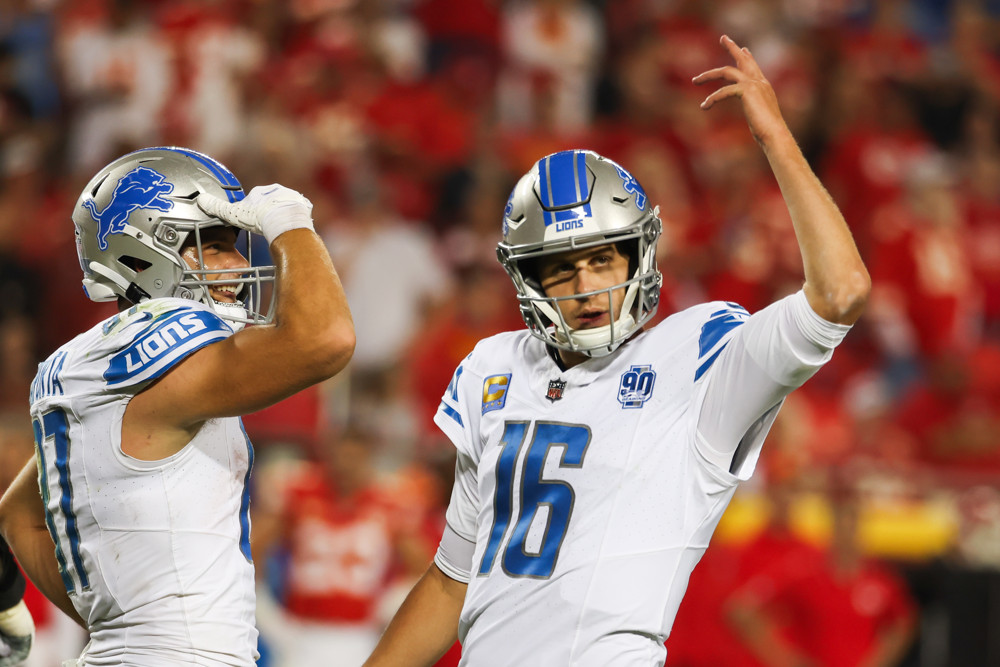
| 4 | Jared Goff | DET | 637 | 407 | 90 | 22.1% | 14.1% | 5 | -1.4 | 27 |
| 5 | C.J. Stroud | HOU | 537 | 319 | 71 | 22.3% | 13.2% | 4 | 0.4 | 3 |
| 6 | Josh Allen | BUF | 604 | 385 | 88 | 22.9% | 14.6% | 6 | -0.1 | 7 |
| 7 | Lamar Jackson | BAL | 502 | 307 | 74 | 24.1% | 14.7% | 8 | -0.3 | 9 |
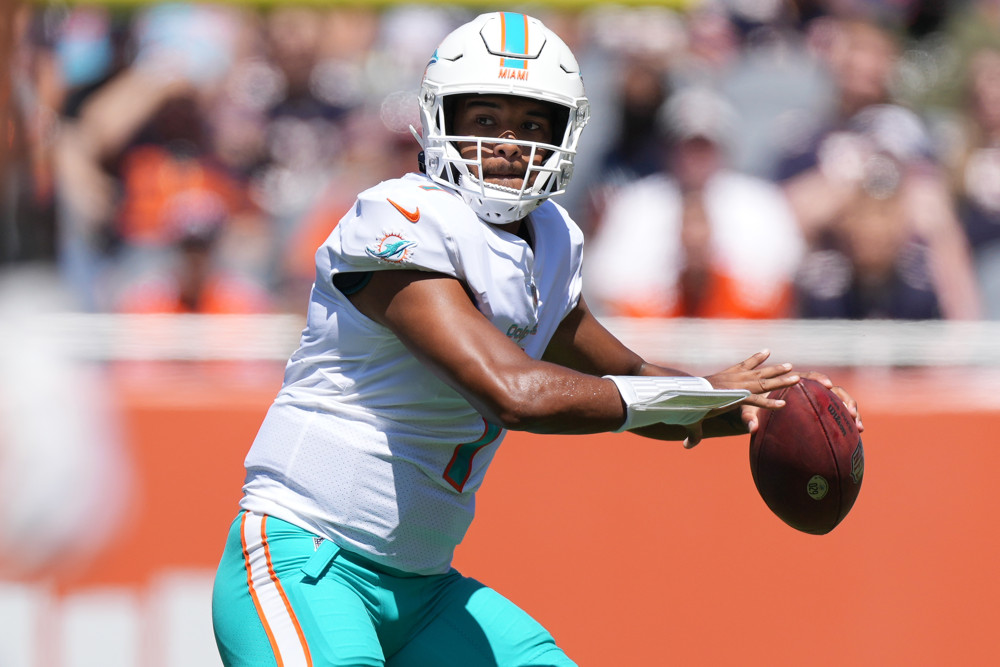
| 8 | Tua Tagovailoa | MIA | 593 | 388 | 94 | 24.2% | 15.9% | 14 | -0.8 | 15 |
| 9 | Geno Smith | SEA | 537 | 323 | 79 | 24.5% | 14.7% | 7 | -1.5 | 28 |
| 10 | Dak Prescott | DAL | 644 | 410 | 101 | 24.6% | 15.7% | 12 | -0.5 | 12 |
| 11 | Jordan Love | GB | 620 | 372 | 92 | 24.7% | 14.8% | 9 | 0.2 | 4 |
| 12 | Desmond Ridder | ATL | 425 | 249 | 64 | 25.7% | 15.1% | 10 | -0.3 | 10 |
| 13 | Jalen Hurts | PHI | 579 | 352 | 92 | 26.1% | 15.9% | 15 | -0.2 | 8 |
| 14 | Trevor Lawrence | JAX | 617 | 370 | 97 | 26.2% | 15.7% | 13 | -0.1 | 6 |
| 15 | Justin Herbert | LAC | 494 | 297 | 79 | 26.6% | 16.0% | 17 | -0.9 | 16 |
| 16 | Patrick Mahomes | KC | 628 | 401 | 107 | 26.7% | 17.0% | 21 | -2.2 | 35 |
| 17 | Baker Mayfield | TB | 614 | 364 | 98 | 26.9% | 16.0% | 16 | 0.0 | 5 |
| 18 | Sam Howell | WAS | 684 | 388 | 106 | 27.3% | 15.5% | 11 | -1.3 | 25 |
| Rk | Player | Team | Pass | Cmp | Failed | FC% | FC% ATT | Rk | ALEX | Rk |
| 19 | Jake Browning | CIN | 271 | 171 | 48 | 28.1% | 17.7% | 24 | -2.2 | 34 |
| 20 | Aiden O’Connell | LV | 369 | 213 | 60 | 28.2% | 16.3% | 18 | -1.1 | 22 |
| 21 | Joe Burrow | CIN | 397 | 244 | 69 | 28.3% | 17.4% | 22 | -1.7 | 31 |
| 22 | Derek Carr | NO | 582 | 375 | 113 | 30.1% | 19.4% | 32 | -0.7 | 14 |
| 23 | Russell Wilson | DEN | 496 | 297 | 90 | 30.3% | 18.1% | 27 | -1.5 | 29 |
| 24 | Gardner Minshew | IND | 532 | 305 | 95 | 31.1% | 17.9% | 26 | -1.0 | 21 |
| 25 | Kirk Cousins | MIN | 330 | 216 | 68 | 31.5% | 20.6% | 34 | -1.2 | 23 |
| 26 | Will Levis | TEN | 282 | 149 | 47 | 31.5% | 16.7% | 19 | 1.5 | 1 |
| 27 | Ryan Tannehill | TEN | 265 | 149 | 47 | 31.5% | 17.7% | 25 | -0.7 | 13 |
| 28 | Zach Wilson | NYJ | 419 | 221 | 70 | 31.7% | 16.7% | 20 | -1.8 | 32 |
| 29 | Joshua Dobbs | 2TM | 454 | 262 | 83 | 31.7% | 18.3% | 28 | -1.0 | 17 |
| 30 | Mac Jones | NE | 371 | 224 | 71 | 31.7% | 19.1% | 31 | -1.7 | 30 |
| 31 | Kyler Murray | ARI | 288 | 176 | 56 | 31.8% | 19.4% | 33 | -2.1 | 33 |
| 32 | Justin Fields | CHI | 418 | 227 | 73 | 32.2% | 17.5% | 23 | -1.4 | 26 |
| 33 | Kenny Pickett | PIT | 353 | 201 | 67 | 33.3% | 19.0% | 30 | -1.0 | 20 |
| 34 | Bryce Young | CAR | 593 | 315 | 112 | 35.6% | 18.9% | 29 | -1.3 | 24 |
| 35 | Tommy DeVito | NYG | 216 | 114 | 48 | 42.1% | 22.2% | 35 | -3.7 | 36 |
| 36 | Bailey Zappe | NE | 237 | 127 | 54 | 42.5% | 22.8% | 36 | -1.0 | 19 |
While the overall number of failed completions were up this year, no one came close to setting any sort of all-time volume record. In 2022, Justin Herbert led the league with 142 failed completions, and 2016 Joe Flacco still holds the all-time mark at 144. Derek Carr’s league-leading 113 this year slides in tied for 10th all-time, with Bryce Young’s 112 tying for 12th and Patrick Mahomes’ 107 tying for 25th. Last year’s failed completions were divided more evenly throughout the league, rather than being focused on just a handful of players.
The fact that your top three were Carr, Young and Mahomes is interesting; that’s not a grouping you would expect to find together in any stat. It was even more interesting before Mahomes rested in Week 18 – he and Carr were tied at 107, with Young at 106, and only taking the week to get healthy kept Mahomes from going from last year’s successful completion percentage leader to this year’s failed completion king. It would have been a much catchier headline if we could have reported that Patrick Mahomes lead the league in failures. Maybe next year.
When you have the best quarterback in the league, a slightly above-average journeyman starter and a disaster of a rookie all neck-and-neck in the same stat, you would expect they got to that point in very different ways. How our three league leaders topped the failed completions chart is more interesting than their gross totals last season.
For Mahomes and the Chiefs, it was a matter of not trusting their wide receivers to catch an even moderately difficult football. Mahomes had the fourth-lowest aDOT on his failed completions at -0.7, with a league-leading 59 failed completions thrown at or behind the line of scrimmage as Andy Reid and company tried to manufacture offense more than they have had to in recent years. Those negative-air yard passes went pretty well when aimed at Rashee Rice (76.5% DVOA) or Travis Kelce (40.6%), but there’s a lot of begging Kadarius Toney to make a play or dumping things to Isaiah Pacheco because no one is getting open mixed in. This is relatively new territory for Mahomes; his aDOT on completions fell from 5.6 in 2022 to just 4.1 last season, and his success rate on those shortest of completions fell from 62% to 54%. The Chiefs got out of it more often than not because Patrick Mahomes is very good at football, but there were large chunks of last season where it felt like Kansas City could not get out of its own way, and that’s what these failed completion numbers are showing. This is why Kansas City drafted Xavier Worthy; it’s an attempt to push the ball downfield more and re-open up the Chiefs’ passing attack.
For Carr and the Saints, it was more an issue of throwing too short on early downs, in part because of some conservative playcalling from Pete Carmichael. 74.8% of Carr’s failed completions came on first or second down, fifth most in the league, and Carr’s ALEX of -2.4 ranked 26th in the league. On third and fourth downs, that flipped; Carr had the fourth-longest ALEX at 3.2 – his average overall ranking in ALEX hides an offense that didn’t try to push the ball past the sticks until it really had to. There just were not enough big plays or schemed-open receivers. Instead, the Saints’ early-down offense featured a lot of dump-offs to Alvin Kamara and Jamaal Williams, as defenses found the offense predictable. That left Carr to nibble and bite and just take what the defense gave him, which often wasn’t much. Kamara ended up leading the league with 39 failed receptions, with 29 of them happening on first or second down. This tended to set the Saints up with decently manageable third downs – they averaged 6.6 yards to go, eighth shortest in the league and generally avoided third-and-long. But it also meant they were very rarely in third-and-short – just 41 third downs of three yards or fewer, 26th in the league. That’s how Carr ended up leading the league in failed completions, and that’s how Carmichael ended up getting fired and replaced with Klint Kubiak, coming from a San Francisco team on the other end of the table.
But Young? Young was just poor in every situation and every down-and-distance. While you don’t want to put too much weight on a rookie’s struggles, a 35.6% failed completion rate is really bad. Most rookies hover around 25%. 35.6% is the worst rate for a passer with 300 attempts, rookie or not, since Mitchell Trubisky in 2017. This was a disaster of a year for Young – he was placed in a bad situation and got the absolute least out of it. If there’s any silver lining here, it’s that at least Young was generally successful in getting the ball out of his hands and towards one of his own teammates; he didn’t throw crazy picks and at least managed to throw his way out of some sacks. But with a below-average arm and well below-average teammates, there wasn’t much Young managed to do to create offense out of chaos. Not ideal for your top pick. It’s worth noting Young got a little better as the year went along, but not by much – he had a 37.5% failed completion rate under Frank Reich, and a 31.3% rate under Chris Tabor. Maybe in 2024, Young can get a few seconds in the pocket from time to time and have one receiver who can gain some separation. If not, we’ll see him right back here again next year.
The only passers who slipped under Young’s failed completion rate were starters of necessity. Tommy DeVito and Bailey Zappe became the third and fourth passers to break the 40% failed completion barrier, joining the Mount Rushmore of Dinks and Dunks with 2018 Nick Foles and, uh, 2015 Nick Foles. Zappe is your new all-time leader in failed completion rate, as the Patriots finished second behind Minnesota with 125 failed completions as a team. Hopefully, we’ll never have to see Zappe or DeVito taking significant snaps again.
Small sample sizes lead to strange results, which brings us to number two on the leaderboard – Joe Flacco. Flacco has been talked about to death in failed completion articles; he has the first-, fifth- and 15th-highest single-season totals ever as he is the all-time GOAT in this particular field. So imagine our shock when Flacco, fresh off his couch, rose all the way to second in lowest failed completion percentage in 2023. Second! It defies belief. Flacco had a failed completion rate of 30.0% with the Jets in 2022. To drop that to 21.1% as an emergency option in Cleveland is remarkable; the 8.9% improvement the biggest we saw in 2023 by far. Other big improvers included Baker Mayfield (6.4%), who found new life (and a new contract) in Tampa Bay, and Russell Wilson (5.0%), who rebounded from a disaster of a 2022 to a merely expensively disappointing 2023; we’ll see if he can hold on to any of those gains with Pittsburgh’s paltry collection of offensive weapons.
On the flip side, Mahomes’ increase of 9.7% was the biggest year-to-year failed completion bump of 2023, but he wasn’t alone. We saw increases of at least 5% from Josh Allen (7.5%), Ryan Tannehill (6.5%), Zach Wilson (5.2%), Dak Prescott (5.1%) and Kirk Cousins (5.1%). That is a wide range of passers of different ability levels and situations, and reflects the leaguewide increase in failed completions last year. It wasn’t just one or two offenses struggling. Offenses left, right, and center were throwing short more than ever before.
But we promised a ray of light, and for that, we have to go to successful completion percentage — – the percentage of all pass attempts that end in a successful completion. This is where we count all failed completions as incomplete passes, removing some of the empty passing calories from completion percentage around the league.
| Successful Completion Percentage, 2023 | ||||||||
| Player | Team | Att | Comp | Cmp% | Rk | Failed | Suc% | Rk |
| Brock Purdy | SF | 444 | 308 | 69.4% | 4 | 55 | 57.0% | 1 |
| Tua Tagovailoa | MIA | 560 | 388 | 69.3% | 5 | 94 | 52.5% | 2 |
| Jared Goff | DET | 605 | 407 | 67.3% | 7 | 90 | 52.4% | 3 |
| Dak Prescott | DAL | 590 | 410 | 69.5% | 2 | 101 | 52.4% | 4 |
| Josh Allen | BUF | 579 | 385 | 66.5% | 11 | 88 | 51.3% | 5 |
| Lamar Jackson | BAL | 457 | 307 | 67.2% | 8 | 74 | 51.0% | 6 |
| Jake Browning | CIN | 243 | 171 | 70.4% | 1 | 48 | 50.6% | 7 |
| C.J. Stroud | HOU | 499 | 319 | 63.9% | 24 | 71 | 49.7% | 8 |
| Patrick Mahomes | KAN | 597 | 401 | 67.2% | 9 | 107 | 49.2% | 9 |
| Matthew Stafford | LAR | 521 | 326 | 62.6% | 27 | 71 | 48.9% | 10 |
| Geno Smith | SEA | 499 | 323 | 64.7% | 19 | 79 | 48.9% | 11 |
| Trevor Lawrence | JAX | 564 | 370 | 65.6% | 14 | 97 | 48.4% | 12 |
| Jordan Love | GB | 579 | 372 | 64.2% | 21 | 92 | 48.4% | 13 |
| Jalen Hurts | PHI | 538 | 352 | 65.4% | 15 | 92 | 48.3% | 14 |
| Joe Burrow | CIN | 365 | 244 | 66.8% | 10 | 69 | 47.9% | 15 |
| Derek Carr | NO | 548 | 375 | 68.4% | 6 | 113 | 47.8% | 16 |
| Justin Herbert | LAC | 456 | 297 | 65.1% | 16 | 79 | 47.8% | 17 |
| Desmond Ridder | ATL | 388 | 249 | 64.2% | 22 | 64 | 47.7% | 18 |
| Player | Team | Att | Comp | Cmp% | Rk | Failed | Suc% | Rk |
| Kirk Cousins | MIN | 311 | 216 | 69.5% | 3 | 68 | 47.6% | 19 |
| Joe Flacco | CLE | 204 | 123 | 60.3% | 32 | 26 | 47.5% | 20 |
| Baker Mayfield | TB | 566 | 364 | 64.3% | 20 | 98 | 47.0% | 21 |
| Russell Wilson | DEN | 447 | 297 | 66.4% | 12 | 90 | 46.3% | 22 |
| Sam Howell | WAS | 612 | 388 | 63.4% | 25 | 106 | 46.1% | 23 |
| Kyler Murray | ARI | 268 | 176 | 65.7% | 13 | 56 | 44.8% | 24 |
| Aidan O’Connell | LV | 343 | 213 | 62.1% | 29 | 60 | 44.6% | 25 |
| Mac Jones | NE | 345 | 224 | 64.9% | 17 | 71 | 44.3% | 26 |
| Ryan Tannehill | TEN | 230 | 149 | 64.8% | 18 | 47 | 44.3% | 27 |
| Joshua Dobbs | 2TM | 417 | 262 | 62.8% | 26 | 83 | 42.9% | 28 |
| Gardner Minshew | IND | 490 | 305 | 62.2% | 28 | 95 | 42.9% | 29 |
| Justin Fields | CHI | 370 | 227 | 61.4% | 31 | 73 | 41.6% | 30 |
| Kenny Pickett | PIT | 324 | 201 | 62.0% | 30 | 67 | 41.4% | 31 |
| Zach Wilson | NYJ | 368 | 221 | 60.1% | 33 | 70 | 41.0% | 32 |
| Will Levis | TEN | 255 | 149 | 58.4% | 36 | 47 | 40.0% | 33 |
| Bryce Young | CAR | 527 | 315 | 59.8% | 35 | 112 | 38.5% | 34 |
| Tommy DeVito | NYG | 178 | 114 | 64.0% | 23 | 48 | 37.1% | 35 |
| Bailey Zappe | NE | 212 | 127 | 59.9% | 34 | 54 | 34.4% | 36 |
Patrick Mahomes’ two-year run at the top of the successful completion table is over, and he’s handed his crown to his opponent in last year’s Super Bowl. Brock Purdy’s first full season as a starter saw him take the lead here – and not by just a bit. His 57.0% successful completion percentage was 4.5 points better than anyone else in the league. Heck, it was almost better than Bryce Young’s entire completion percentage. Not a bad little year at all.
The fun thing about this table is that you can use it as evidence for your argument, no matter what you think of Purdy. Purdy supporters will love him being in first place, continuing his statistical argument for being a top-tier quarterback. Detractors will point to the sheer number of Shanahan-esque systems atop these rankings, as well as the fact that Jimmy Garoppolo finished second in each of the last two seasons before cratering in Las Vegas. Still others might suggest that the gap between Purdy and everyone else was indicative of poor quarterback play around the league – while Purdy was successful, the magnitude of that success was increased because of a lack of strong competition.
All of these arguments are well and good and have their merits, but the hard part is wrapping your head around that 57.0% number. It’s clearly good, if it’s at the top of the table, but no one has an instinctive feel of just what that number means. There’s no context around it. Well, we can fix that. This offseason, we pushed DVOA back to 1979. Here, then, are the top 25 successful completion percentage seasons of the past 45 years.
| Best Successful Completion Percentage, 1979-2023 | |||||
| Year | Player | Team | Comp | Failed | Suc% |
| 2007 | Tom Brady | NE | 398 | 56 | 59.2% |
| 1982 | Ken Anderson | CIN | 218 | 36 | 58.9% |
| 1994 | Steve Young | SF | 324 | 56 | 58.1% |
| 2004 | Peyton Manning | IND | 336 | 48 | 57.9% |
| 2020 | Josh Allen | BUF | 396 | 65 | 57.9% |
| 2020 | Deshaun Watson | HOU | 382 | 69 | 57.7% |
| 2011 | Drew Brees | NO | 468 | 89 | 57.7% |
| 2019 | Drew Brees | NO | 281 | 67 | 57.5% |
| 2011 | Tom Brady | NE | 401 | 52 | 57.1% |
| 2023 | Brock Purdy | SF | 308 | 55 | 57.0% |
| 1993 | Steve Young | SF | 314 | 51 | 56.9% |
| 2000 | Kurt Warner | STL | 235 | 38 | 56.8% |
| 1989 | Joe Montana | SF | 271 | 52 | 56.7% |
| 2013 | Philip Rivers | SD | 378 | 70 | 56.6% |
| 2020 | Mitchell Trubisky | CHI | 199 | 31 | 56.6% |
| 2020 | Dak Prescott | DAL | 151 | 26 | 56.6% |
| 2006 | Peyton Manning | IND | 362 | 47 | 56.6% |
| 2019 | Ryan Tannehill | TEN | 201 | 41 | 56.5% |
| 2005 | Peyton Manning | IND | 305 | 49 | 56.5% |
| 2004 | Daunte Culpepper | MIN | 379 | 71 | 56.2% |
| 1991 | Jim Kelly | BUF | 304 | 38 | 56.1% |
| 2020 | Aaron Rodgers | GB | 372 | 80 | 55.9% |
| 1983 | Ken Anderson | CIN | 198 | 32 | 55.9% |
| 1983 | Dan Fouts | SD | 215 | 25 | 55.9% |
| 2020 | Patrick Mahomes | KC | 390 | 62 | 55.9% |
Oh, so that’s really good, then.
It’s an interesting table, that. You have six years from 2020, which is going to forever have the COVID asterisk messing up historical tables. You have 15 years from players either in the Hall of Fame or going to be – and one more if you want to give Philip Rivers an early pass. You have two more from Ken Anderson, ever doomed to be freshly discovered by generations of new analytics nerds running historical stats. You have a glut of players from the 21st century, making the high scores from Anderson, Steve Young, Joe Montana, Jim Kelly and Dan Fouts even more impressive.
And then you have the three outliers: 2004 Daunte Culpepper, who blew out his knee the next year and was never quite the same again; 2019 Ryan Tannehill, who had a fantastic half-season with the Titans that he could never quite replicate again; and 2023 Purdy. It’s a heck of a group to be with.
Yes, Purdy’s numbers were surely inflated by his coach and the plethora of weapons he got to use. But over the past 45 years, there have been other quarterbacks with great coaches and great offenses. That Purdy keeps showing up at the top of these sorts of lists is exceptional. Now, he just has to show he can do it again. No pressure.
What about the receivers on the other end of those failed completions? It’s worth taking a look at that, even though appearances here generally have more to do with usage and scheme than a receiver’s individual talents. We exclude running backs from these tables; they would otherwise dominate due to their roles in checkdowns and emergency outlets. For the record, however, Alvin Kamara led all players with 39 failed receptions, with Breece Hall (38) and Ezekiel Elliott (30) just behind him among running backs.
| Most Failed Receptions (WR/TE) | ||
| Receiver | Team | Failed |
| Evan Engram | JAX | 38 |
| Michael Pittman | IND | 30 |
| T.J. Hockenson | MIN | 29 |
| David Njoku | CLE | 28 |
| CeeDee Lamb | DAL | 26 |
| Adam Thielen | CAR | 24 |
| Tyler Boyd | CIN | 22 |
| Garrett Wilson | NYJ | 22 |
| Stefon Diggs | BUF | 22 |
| Tyler Conklin | NYJ | 22 |
| Tyreek Hill | MIA | 22 |
| Travis Kelce | KC | 22 |
| Lowest Failed Reception Rate (WR/TE) | ||||
| Receiver | Team | Rec | Failed | Pct |
| Justin Watson | KC | 27 | 0 | 0.00% |
| Brandon Aiyuk | SF | 75 | 1 | 1.30% |
| Tee Higgins | CIN | 42 | 1 | 2.40% |
| Gabriel Davis | BUF | 45 | 2 | 4.40% |
| Amari Cooper | CLE | 72 | 4 | 5.60% |
| Alec Pierce | IND | 32 | 2 | 6.30% |
| Christian Watson | GB | 28 | 2 | 7.10% |
| D.K. Metcalf | SEA | 66 | 5 | 7.60% |
| Dontayvion Wicks | GB | 39 | 3 | 7.70% |
| Odell Beckham | BAL | 35 | 3 | 8.60% |
| Mike Evans | TB | 79 | 7 | 8.90% |
| Hunter Henry | NE | 42 | 4 | 9.50% |
| Highest Failed Reception Rate (WR/TE) | ||||
| Receiver | Team | Rec | Failed | Pct |
| Rondale Moore | ARI | 40 | 16 | 40.00% |
| Jonathan Mingo | CAR | 43 | 16 | 37.20% |
| Tyler Conklin | NYJ | 61 | 22 | 36.10% |
| Gerald Everett | LAC | 51 | 18 | 35.30% |
| David Njoku | CLE | 81 | 28 | 34.60% |
| Josh Palmer | LAC | 38 | 13 | 34.20% |
| Evan Engram | JAX | 114 | 38 | 33.30% |
| Wan’Dale Robinson | NYG | 60 | 20 | 33.30% |
| Tyler Boyd | CIN | 67 | 22 | 32.80% |
| Jaxon Smith-Njigba | SEA | 63 | 20 | 31.70% |
| Chigoziem Okonkwo | TEN | 54 | 17 | 31.50% |
| Josh Downs | IND | 68 | 21 | 30.90% |
There are plenty of good receivers on the failed receptions leaderboard – CeeDee Lamb, Stefon Diggs, Tyreek Hill and Travis Kelce all stand out. “Throw the ball to them and let them make a play” is generally a good offensive strategy, and their high number of failed completions just reflects their high overall usage rate and the trust their offenses have in them. Similarly, it’s far from the end of the world for a tight end outlet like T.J. Hockenson to lead the league in failed receptions; a large part of his role is “be there to catch the ball so we get something, rather than nothing.”
Those excuses do begin to fail a little bit when you’re talking about two or three failed receptions each and every week, like with Evan Engram. Engram, who went to the Pro Bowl last year, averaged just 8.4 yards per reception, third lowest among non-running backs. A full third of his receptions ended up making no yards of note. And this is not new for Engram, either – this is his third appearance on the yearly failed receptions tables, albeit his first in the failed reception rate list. Good players show up on these tables when their offenses have bad years, but Engram’s made the failed reception his primary skillset since getting off his rookie deal. He’s not a terrible player by any stretch of the imagination, but a certain point, you must be able to occasionally turn upfield with the ball. For a third of your receptions to be failures on over 100 catches? That must at least broach the subject of replacing him with someone who can provide more production for Trevor Lawrence.
Engram, Hockenson, Lamb and Hill all return to the total failed reception leaderboard from last year, alongside Michael Pittman and Tyler Conklin.
We typically have a 30-reception minimum for our rate tables, but I wanted to make sure to squeeze Justin Watson on this year’s list. Watson spent most of 2023 running go routes for the times when Mahomes and the Chiefs didn’t check the ball down. He’s a destitute man’s Tyreek Hill. His 17.9 aDOT was more than two yards deeper than any qualified receiver, and every single one of his 27 receptions qualified as a success. 21 picked up a first down or touchdown. A perfect year, if you ignore the 26 passes that went his way that he didn’t catch. I would call Brandon Aiyuk’s year more impressive, with just one failure in his 75 receptions. The failure? A 10-yard gain on 2nd-and-21. It’s no wonder he wants a massive contract extension; that’s about as good as you’re going to get.
The successful reception rate table is generally a list of deep threats, which explains Gabe Davis being the only holdover from 2022. Repeat appearances on the failed reception rate tables isn’t typically great for your long-term career, but both Rondale Moore and Tyler Conklin have now made the list three years in a row. For Moore, it was another year of being relegated to gadgets and screens to no return. He was traded to Atlanta in the Desmond Ridder deal, though, so maybe a new offense might afford him the opportunity to run even one downfield route. Meanwhile, anyone who can explain just why Tyler Conklin was the Jets’ second-leading receiver in 2023 is encouraged to do so; it surely remains a mystery to us.